The Everything Bubble and Its Aftermath
The challenge in forming investment conclusions and, most importantly forecasting investment outcomes, is that human nature does not observe reliable rules. At certain times, people behave as they have in the past. At others, they don’t—apparently similar conditions evoke different behavior, in magnitude or even direction. Forming an investment conclusion is therefore fraught with risk. Uncertainty causes discomfort but is the ever-present traveling companion.
In our last post we chose the unusual outcome of the Mississippi Bubble in France of 300 years ago for multiple reasons. First, it was an early lesson in speculation in the financial markets. It was thus a demonstration of a most important investment lesson—human nature doesn’t change. It was also noteworthy for its excesses. The share price of the Mississippi Company rose spectacularly, and soon afterward crashed, as bubbles invariably do. They become detached from the eventual reality of maintaining their excessive rates of return and, when the crowd that chased them skyward understands its error, fall even faster than they rose.
We have recently been through another bubble or, more accurately, a series of coincident bubbles in multiple assets at the same time. Bonds, stocks, houses and other less mainstream assets reached their apexes in (or around) 2021. This has been referred to as the Everything Bubble. The simultaneity has been explained by the descent of interest rates to levels that were unprecedented—close enough to zero on default-risk free securities, including Treasury bonds, which are the basis for discounting future cash flows and thus the prices for assets in general. While it is useful to study bubbles, the aftermaths get less attention. The histories may chronicle the rise and fall, but the salient question to us now is, what next? The next year – 2022 – was, as many now understand, a return to earth. We thought it useful to explore whether the correction of error is complete, or not.
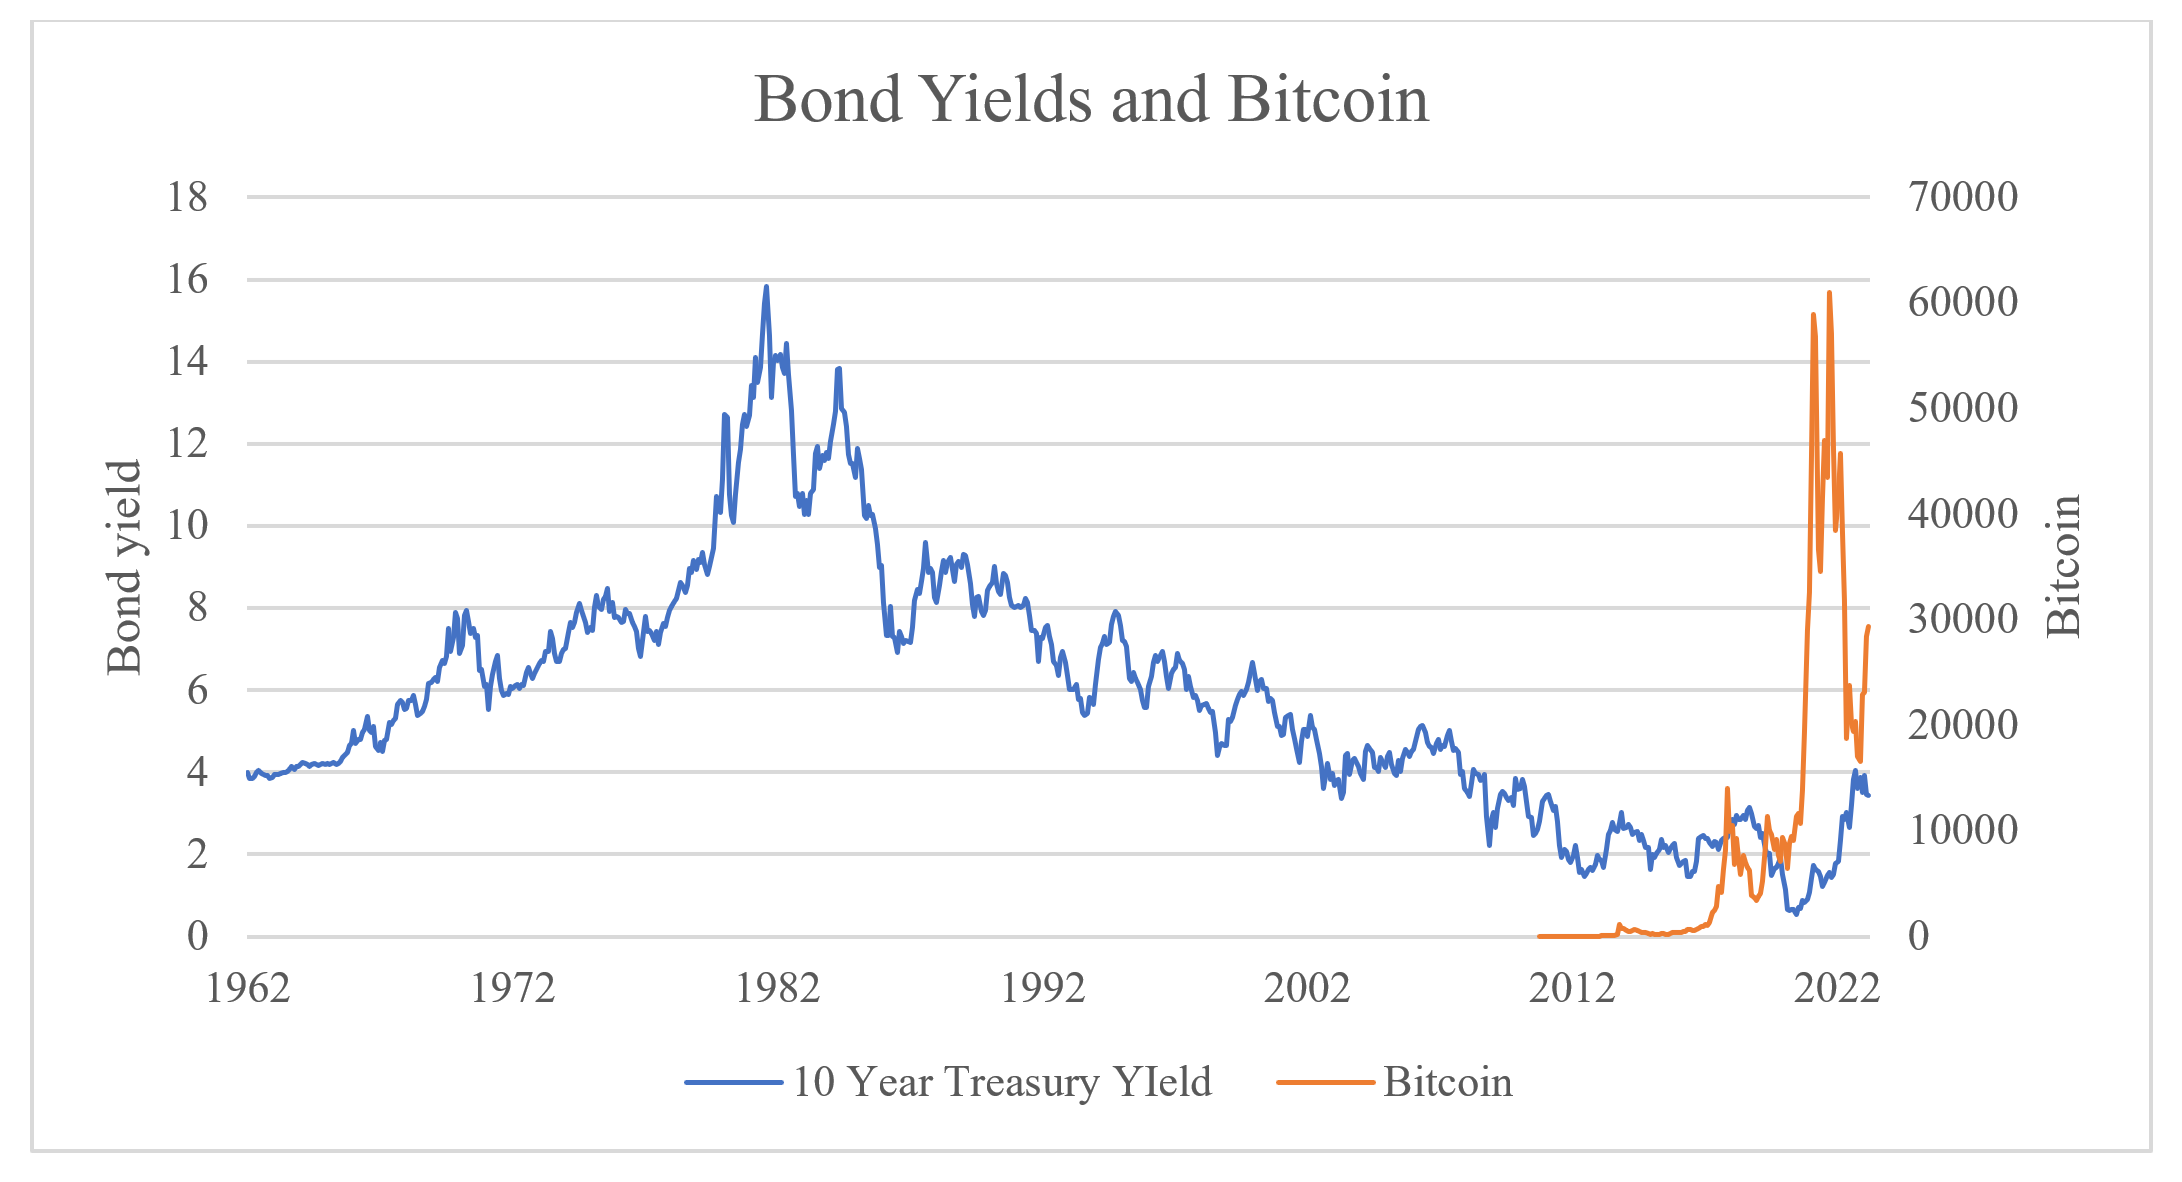
In the first chart we show the yield on the ten-year Treasury, the benchmark security for pricing longer-term assets. Last year reversed the long decline that corresponded to a decline of inflation over the same period. We have used the entire history in electronic form available to us (Bloomberg):

Other sources go back much further. Homer and Sylla’s tome A History of Interest Rates is a reference source on the topic. The lowest government yields in the U.S prior to this were around 2.5% in the 1940s as the Federal Reserve engaged in yield curve control to aid in the government financing of World War II. Those authors report yields at that level or modestly lower on British government yields in the 19th century. (Yields in Genoa, Italy, reached just over 1% in 1619, but the authors question their comparability with other series.) The recent low of 0.51% on the 10-year Treasury appears to have little or no competition, at least so far.
As the discount rate applied to future cash flows approaches zero, intrinsic value, or the present value of future cash flows, explodes. Such behavior by the default-risk free benchmark is the primary explanation of the Everything Bubble. But it is not the only one.
Risky assets require that an additional component be added to the risk-free rate to provide an appropriate price. This is when animal spirits, as they are known, enter the equation, and it is when the danger of overpaying becomes acute. Responsibility for the recent overvaluation lies in part with the Federal Reserve, where there was surprisingly little argument at the time. One member of the committee was the president of the Kansas City district banks, Thomas Hoenig. He had observed prior speculative periods and cautioned against taking the risk implied by Chairman Ben Bernanke’s policies as chronicled in the book The Lords of Easy Money. It was not uncommon that he was a lone dissenter in the Fed’s meetings.
Price-earnings ratios (P/E) are a shorthand method of pricing equities as a convenient alternative to the more laborious present value calculations. While their omission of detail is a handicap, simplicity can be a virtue also. They also give us a convenient way of placing the present in historical context as a measure of the riskiness of current market conditions and can be, at times, a general measure of animal spirits. Professor Robert Shiller proposed the Cyclically Adjusted Price-Earnings Ratio, or CAPE, years ago as a way of considering equity valuations in historical perspective. It calculates a P/E ratio on average earnings over ten years’ time as a way of reducing the effect of the business cycle on any specific observation. In Chart 2 we show the results from its inception:

It is difficult to make the case that stocks are a bargain, even after their performance in 2022. In fact, the current level looks more like the right shoulder of a peak that was exceeded only once before in the period that remains known as the “Dot-com boom” of 20 years ago and remains the high-water mark. Despite a difficult 2021 the valuation of stocks remains high enough to suggest a return of low- to mid-single returns.
Recent experience also appears elevated in another of the important asset classes. Housing reached new highs as well:

So it is that the unprecedented lows in Treasuries had a long reach into multiple assets, many of which produced unusual behavior. We will add that there were none more unusual than a new entrant, cryptocurrencies. In Chart 4 we place one of them, Bitcoin, in a longer-term context of the stock market over the last several decades. The result is rather astonishing and shows the sudden appearance of the new asset class, if that is what it is. Stocks have been accumulating their record over this period by grinding out returns that over time compound to a good result. Bitcoin performed its feat in a few heartbeats:

In the appendix we include the same performance in the context of Treasury bonds and single-family residences in the U.S. The results are similar, whichever tortoise one picks for comparison with the hare.
Opinions on cryptocurrencies range from reverence among their followers to derision from their doubters. There remains among the latter group a question about whether crypto assets have any real use. Bitcoin was a pioneer and was developed with the idea of a currency that was not under the control of a sovereign government, but its success is debatable. Monies in conventional wisdom serve as mediums of exchange, units of account and stores of value. It is not clear that even Bitcoin, let alone others, count those as primary uses.
It may be useful, then, to consider assets that prospered at the same time as cryptocurrencies to identify a personality in common and thus better understand their future. In Chart 5 we plot Bitcoin with the shares of ARKK Innovation, an exchange-traded fund with a clear focus on young technology firms with relatively recent inception and limited history:

Here we find a good comparator. The performance of the two is obviously quite similar. Both shot up as the world emerged from the market contractions early in the Covid pandemic, benefitting from the very low interest rates that characterized the period. They peaked in 2021 and fell back to earth in 2022. It is not a coincidence that they share something else—they are difficult to analyze, and to value.
It appears safe to conclude that we have recently witnessed a period of financial speculation that has completed. But the salient question that remains is whether the corrective period completed with the disappointing performance of 2022.
Analysts at Bernstein Research attempted to answer this question by looking at history. As research analysts their particular focus was technology stocks, but to assess bubbles they looked more generally at the history of equity valuation over the last 50 years. They considered the stock market valuation by sector, looking at valuations of the various groups and how they behaved over time. They concluded that the period included four bubbles: the “Nifty Fifty” that concluded in 1972, the energy crisis of the 1980s, and two tech bubbles in the 1990s and the recent one that ended in 2021. The declines following those peaks lasted about three years.
This seems as good a guide as any for what we should expect this time. The declines were material in 2022 but history suggests this declivity is not complete for the assets that enjoyed celebrity status. The best candidate for a fundamental reason at this point is inflation, which has already pressured valuations. The severity of the reaction this time will be affected by whether the Federal Reserve does in fact persist in their campaign to reduce inflation. The task is the same as the one they faced 40 years ago, and that time they were successful. The current period differs from that episode in one important respect, however. Debt levels today are considerably higher than they were then. The result is that there are more ways that a tight money policy may produce insolvencies, which if broad enough could derail the Fed’s campaign. Their quest to return to 2% inflation is praiseworthy but looks optimistic.
References:
Homer, Sidney & Richard Sylla, A History of Interest Rates, Wiley, 2005.
Sacconaghi, Larson, Murdia and Zhu, Bernstein, March 2023.
Leonard, Christopher, Lords of Easy Money, Simon & Schuster, 2022.
Appendix: Bitcoin and other principal asset classes
Treasury Bonds and Bitcoin:
Single-family U.S. real estate and Bitcoin:

John is a Senior Research Consultant whose primary responsibilities include contributing differentiated macroeconomic perspectives as well as providing industry and company research.
In addition, he writes investment commentary, which is published on our website.
John has worked in the investment industry for over 45 years. He was formerly our Director of Research. Prior to joining BFS, he was the Chief Investment Officer at New England Asset Management, Inc.
John has achieved the designations of Chartered Financial Analyst® and Certified Public Accountant.
Subscribe
Sign up to receive our latest insights