Are We in the Eighth Inning of This 16-Year Secular Bull Market?
Bull markets are born on pessimism, grow on skepticism, mature on optimism and die on euphoria.
Sir John Templeton
The above quote from Sir John Templeton is well-known, but it does seem to hold true for the times. The S&P 500 Index is trading at an all-time high, having achieved a total return of over 1200% since the March 2009 bottom. Is euphoria in the air now? And, what happens when a stock market “bubble” breaks? There are numerous investors too young to remember the gut-wrenching anxiety that the Financial Panic of 2007-2009 induced. At the end of 2008, the S&P 500 was trading at around 1,000 — down from its high of 1,570 in October 2007. President Obama took office in January 2009, and the market went further into freefall as the banking system, along with Fannie Mae and Freddie Mac, seemed headed for a catastrophic collapse. Investors feared that U.S. banks would be nationalized. The S&P 500 plummeted by another 33% between early January and early March 2009. From its peak of 1,565 at the October 9, 2007 close, the S&P 500 plunged to 666 on March 9 when the market bottomed out after a 57.4% drop. It began to rebound only after investors concluded that banks were not going to be nationalized by the Obama administration.
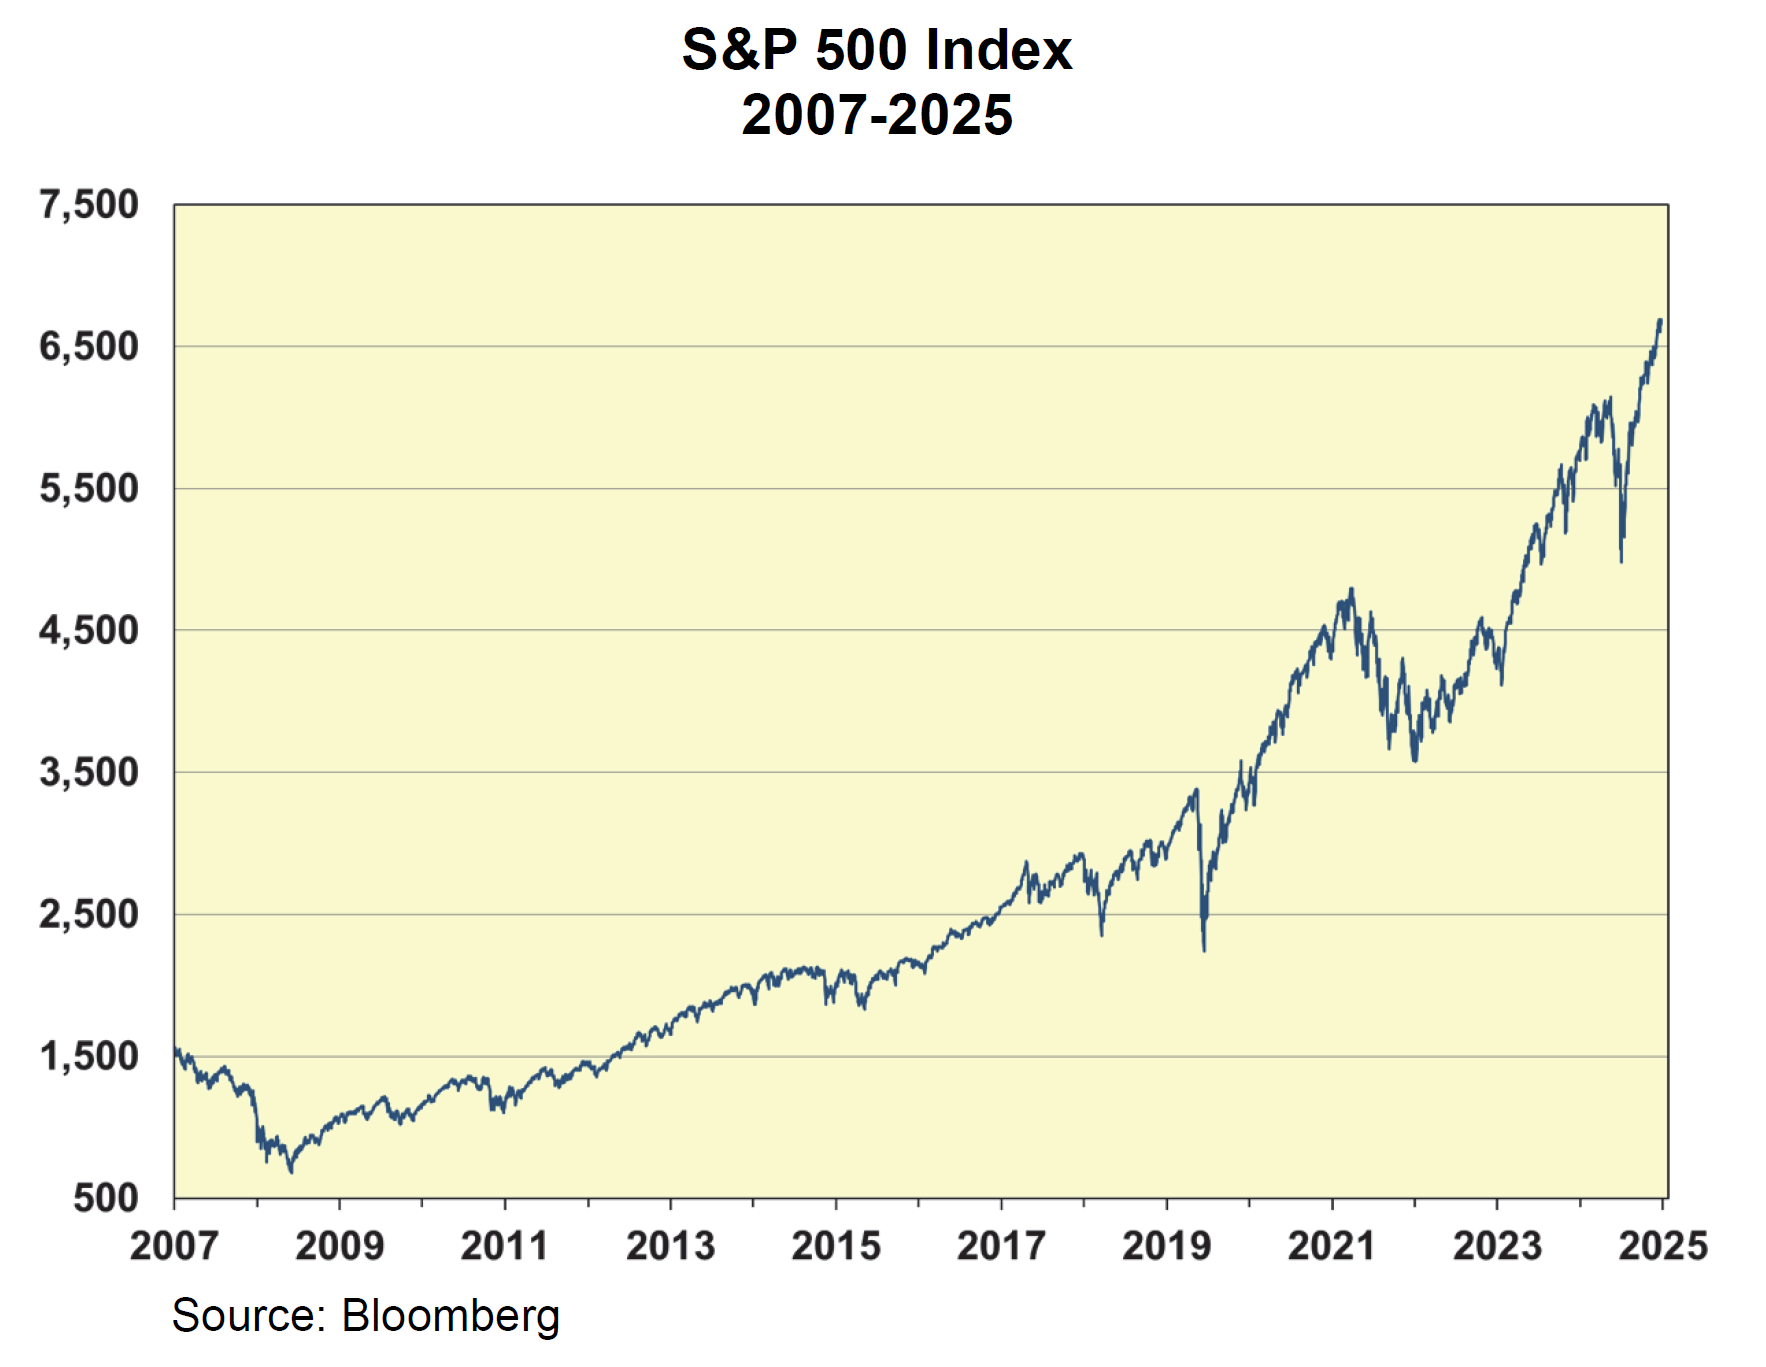
As Sir John Templeton so accurately described in the above quote, this great secular bull market of 2009- 2025 was born on the stark pessimism of the Financial Panic, which reached its fullest extent in March 2009. By the end of 2009, the S&P 500 had climbed back more than 65% to finish the year at close to 1,100, and this great secular bull market was underway. The chart below shows the path of this 16½-year bull market, which has advanced from 666 on the S&P 500 to 6,740 as this commentary is written:
Proximate Factors Leading to the 2009-2025 Bull Market
This long-running secular bull market has taken place during a period of relatively modest GDP growth, which averaged around 2.5% annually over this 16½-year period. This does not compare well with the average GDP growth during the entire 20th century of approximately 3.2%. But there have been reasons beyond that of national economic growth that account for the long-running advance of the stock market. Five major factors have propelled the stock market’s lengthy advance: a washed-out stock market valuation in March 2009; the lowest interest rates in our country’s history; skyrocketing national debt; higher corporate profit margins; and the Artificial Intelligence (AI) revolution. Below is a brief exposition of these five factors that led to this robust bull market:
- Stock Market P/E Ratio: The forward P/E ratio of the S&P 500 when the stock market bottomed out in March 2009 was approximately 10. Currently, with the S&P 500 trading at 6,740 and estimated operating earnings forecast to come in at $304, the P/E ratio of the S&P 500 is 22.3. With the P/E ratio having more than doubled, this factor accounts for more than half of the market’s gain.
- Enormous Growth in Federal Debt: In 2009, the inception of the bull market, the U.S. consumer was overleveraged with excessive housing debt of almost $10 trillion at the end of 2008. During the following 10 years, housing debt dropped as consumers tightened their collective belts, and remained under $10 trillion until 2019. In the meantime, the U.S. government has run enormous annual budget deficits every year from 2009 through 2025. Federal debt was $10.6 trillion at the beginning of 2009. It has more than tripled in 16 years to $37.4 trillion currently. This profligate spending by the U.S. government created much of the liquidity which investors have used to bid up stock prices.
- Rock-Bottom Interest Rates: In order to create stability in the financial markets in 2008-2009, the Federal Reserve brought the target federal funds rate to a range of 0.00-0.25% in December 2008. The Fed kept the rate at this record low level for seven years, until late 2015. Later, to combat the economic impact of the COVID-19 pandemic, the central bank again lowered the rate to the same 0.00-0.25% range in March 2020. These rock-bottom interest rates provided excessive liquidity, resulting in speculation and the trading of meme stocks in 2021 and in certain market sectors currently.
- Corporate Profit Margins: While U.S. GDP growth has averaged a modest 2.5% annually during this bull market, the profit margins of companies in the S&P 500 have increased from an average of around 8% during the first decade of this century to 13.6% currently, according to J.P. Morgan. This dramatic increase in profitability — especially for the giant, world-class U.S. companies in the technology and communications sectors — has led to higher valuations for many companies in these sectors — especially the Magnificent 7 which have led the market’s advance.
- The Artificial Intelligence (AI) Revolution: The dot-com bubble took off in 1995, and the S&P 500 turned in a total return in excess of 20% that year and in each of the next four years. But then starting in June 1999, the Federal Reserve raised the fed funds rate six times until it reached 6.5% in May 2000, causing the internet bubble to burst. The past several years have seemed eerily similar, with the stock prices of companies such as Nvidia, Meta, Alphabet, and Microsoft, as well as leading software companies, soaring over the past five years. As in the internet revolution, we at BFS believe that AI will change the way the world works. AI is here to stay and should ultimately increase productivity (a key component of GDP growth) significantly. The AI revolution has had much to do with the stock market’s advance to its all-time high.
Valuation of the Stock Market
One of the key fundamental measures used to determine how the stock market is valued is its P/E ratio. With the S&P 500 and the Dow Jones at all-time highs, are we in a “bubble”? The table below shows how the current market P/E ratio compares with market valuations over the past five decades:

Several observations need to be made about the numbers in this table. The first is the 19-fold growth of the S&P 500 earnings during this 39-year period. This remarkable growth highlights the engine of democratic capitalism at work. The second is the exalted valuation of the stock market in 1999 at the tail end of the dot-com bubble. The third is that the stock market’s P/E ratio since 2019 has remained elevated.
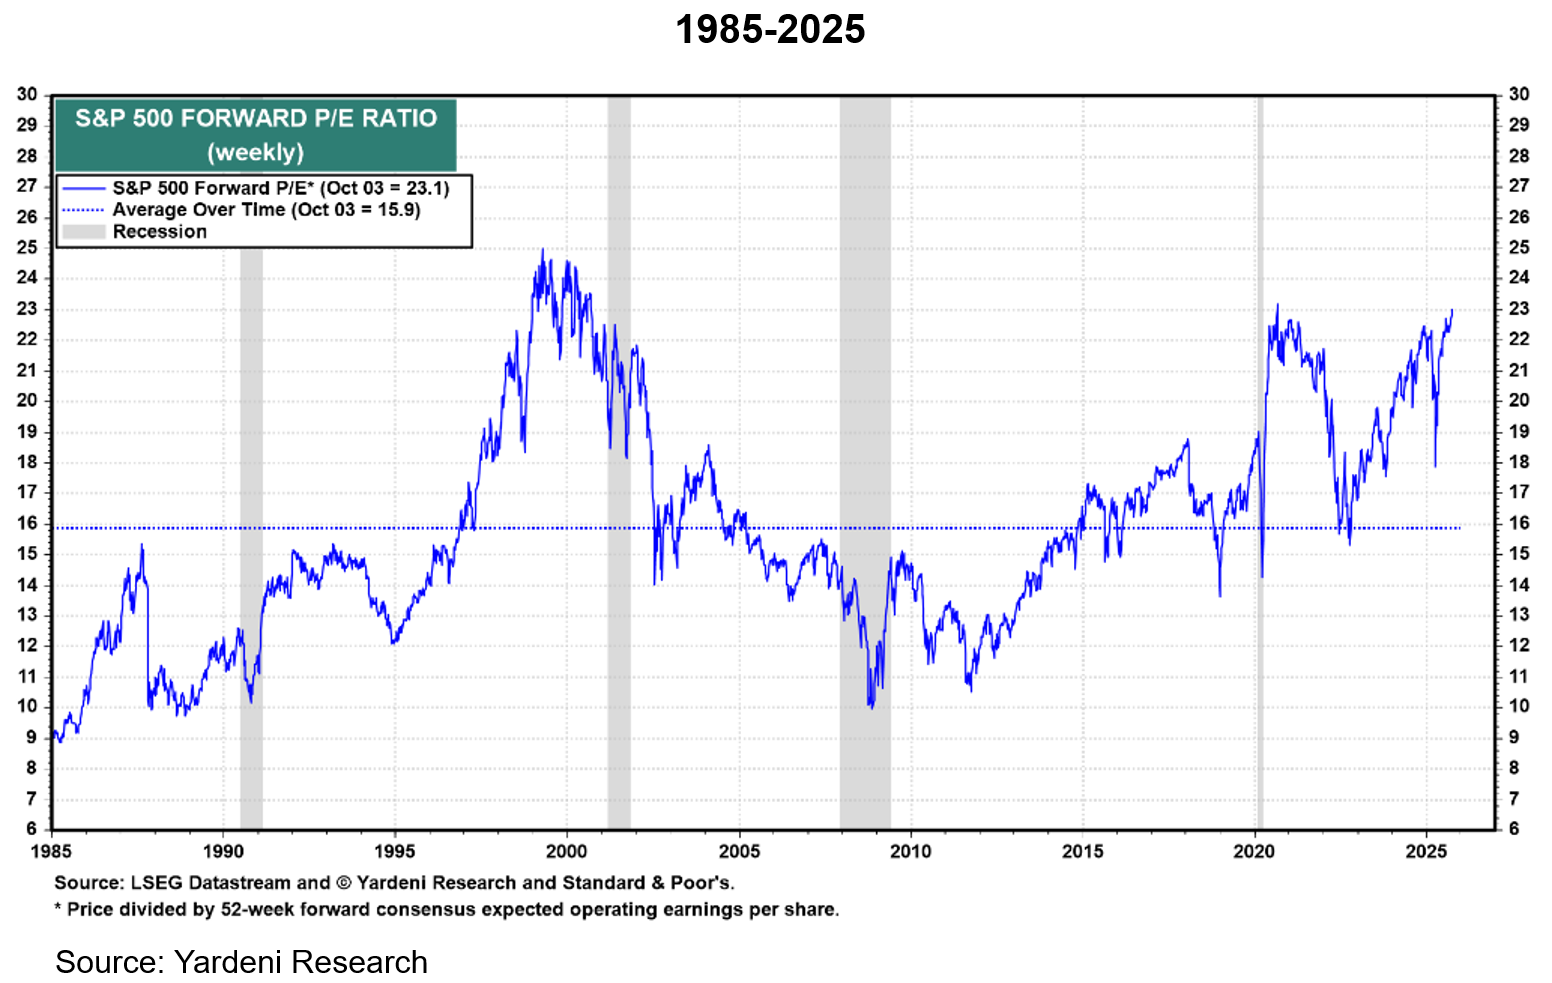
The chart on the following page is an excellent example of the stock market’s expensive valuation during both the dot-com boom and the AI revolution. 2022 was the only recent year when the P/E dropped below 20, as the Federal Reserve raised the fed funds rate seven times to curb the worst inflation in 40 years, causing a mini-bear market.
Time-Tested Rule of Stock Market Valuation
In previous investment commentaries, we have written about the Rule of 20. It is important to remind our readers again how this rule of thumb works. The Rule of 20 suggests that the market’s P/E ratio should be the last 12 months’ inflation rate subtracted from 20. For example, the inflation rate in the U.S., according to the CPI statistics calculated by the Bureau of Labor over the past 12 months, was 2.9%. Subtracting 2.9 from 20 means that a reasonable valuation of the stock market at this inflation level is 17.1. By this measure, the S&P 500 currently appears to be approximately 23% overvalued. The chart below shows the S&P 500’s P/E ratio when taking into account inflation. The chart also measures the averages during two different periods:

With inflation currently in the 2-4% range, the P/E ratio over the period reaching back to 1950 has averaged 17.7, suggesting that the S&P 500 currently is roughly 20% overvalued (close to the calculation of 23% produced by the Rule of 20). However, measuring it using the P/E ratio of 19.3 for the period going back only to 2008, the S&P 500 in this approach is only 12.7% overvalued. Using the 17-year period to measure the average P/E, however, seems somewhat questionable, as this period measures the P/E ratio solely during the current secular bull market. Perhaps the most important takeaway is that regardless of which measurement is used, the S&P 500’s current P/E on forward earnings of 22.3 seems stretched.
Three Different Stock Markets
In analyzing the stock market and how it is priced, there appear to be three different markets, each comprising different kinds of companies. Below are examples of the P/E ratios based on 2026 earnings of companies in these three markets:
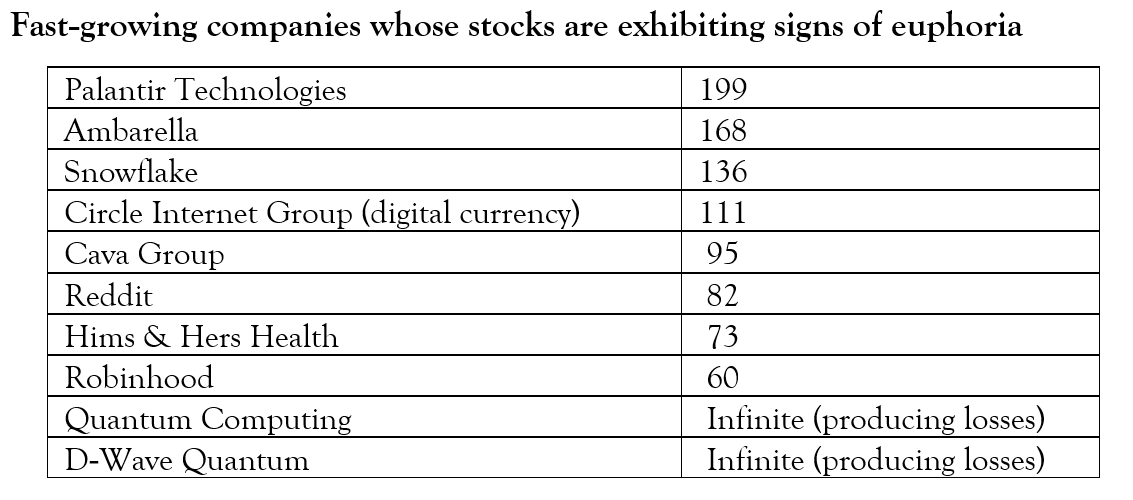
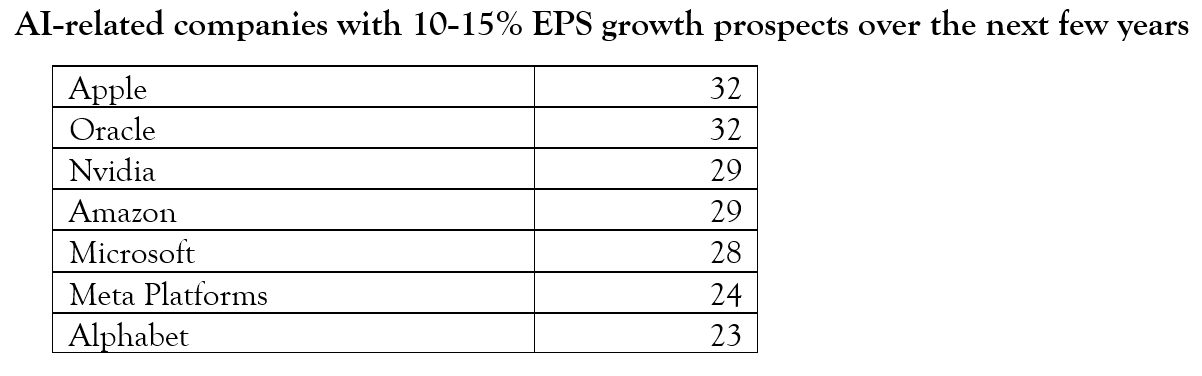
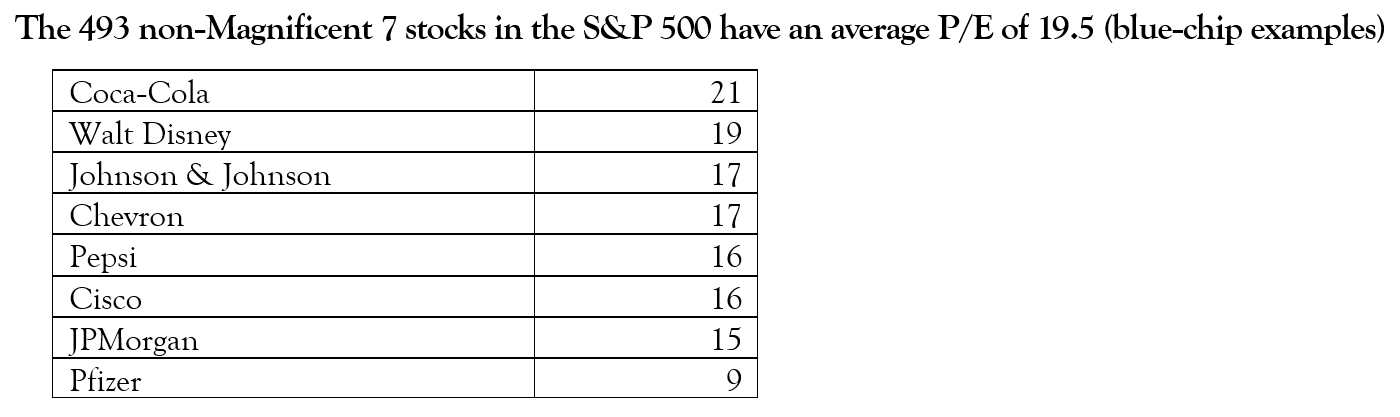
In reviewing the companies and their valuations in these three markets, it is difficult to make a broad, definitive judgment on the valuation of the stock market. It is, as always, a market of stocks, and currently, a market with very diverse characteristics. Clearly, there is much speculation in stocks in great companies like Palantir, whose market capitalization is currently $410 billion with projected sales in 2026 of only $5.6 billion. This translates to a price-to-sales (P/S) ratio of 73.2 and P/E ratio of 199. Palantir must be considered a meme stock currently. This speculative sector of the market reminds one of the internet bubble of 2000, when great companies like Cisco were selling at P/E multiples of 100 or more. (When the bubble burst, Cisco’s stock fell from $77 to $10 and still has not recovered to its all-time high in 2000.) Then there are the world-class Magnificent 7 companies whose valuations are elevated but reasonable when considering EPS growth in the teens, resulting in solid PEG ratios of 2 or less (a PEG ratio is the P/E ratio divided by the EPS growth rate). And finally, many of the remaining companies in the S&P 500 have valuations at or below the time-tested Rule of 20.
Two 17-Year Secular Bull Markets in the 20th Century
Before attempting a conclusion about the path of the stock market, it is important to point our readers to the aftermath of two other secular bull markets that ran for similar periods of time. The first 17-year bull market ran from 1949 through 1966. In January 1966, the Dow Jones hit 1,000; 16 years later in June 1982, the index was trading around 812. A lost decade and a half in the stock market due to the Vietnam War, political upheavals, the OPEC shocks, and skyrocketing inflation!
The second 17-year bull market took place in the years 1982-1999. The stock market advanced dramatically during the 1980s, as President Reagan not only cut taxes and reduced regulations, but also, in conjunction with Federal Reserve Chairman Paul Volcker, brought inflation down from 13.5% in 1980 to 4.4% in 1988. The S&P 500 subsequently advanced more than 20% during each of the five consecutive years between 1994 and 1999, as capital gains taxes were cut from 28% to 20%, and the internet revolution took off. The combination of the collapse of the internet bubble and the great Financial Panic of 2007-2009 caused the first decade of the 21st century to be a lost decade for investors. The price of the S&P 500 Index was 24% lower at the end of 2009 than at the start of the decade.
Conclusion
As the German adage goes, “Die Bäume wachsen nicht in den Himmel,” meaning trees don’t grow to heaven. Something happens to halt their growth. In a similar manner, bull markets don’t run forever; something happens to cause a correction or a bear market. It is quite likely that much of the enormous amount of capital being deployed into AI will not deliver significant returns. That will probably cause the stocks of some of the AI-related companies to falter. There are also growing risks of sovereign debt crises, due to the inexorable rise of national debt, both in the U.S. and abroad. The dramatic rise in the price of gold and Bitcoin in the past several years is a sign of this danger. Inflation may spike higher, causing interest rates to rise. And, last but not least, Putin’s war on Ukraine (as well as the recent incursions of planes and drones into NATO airspace) and the continuing conflict in the Middle East could easily spiral out of control, causing markets to fall. Perhaps most importantly of all, the stock market has been greatly helped by the performance of the Magnificent 7 and other AI-related stocks, and their outperformance cannot continue forever. At BFS, we do not believe it is easy to call the direction of the stock market; we are in it for the long haul. So, we are not sellers of quality companies at this time. But with the elevated valuation of the stock market, some investors may want to reduce their equity allocation to allow for a margin of safety. We could well be in the final innings of this great 16½‑year secular bull market.
Rob serves as chairman of Bradley, Foster & Sargent. He is a portfolio manager and member of the firm’s investment committee and its board of directors.
Rob founded Bradley, Foster & Sargent with Joseph D. Sargent and Timothy H. Foster. Earlier, he was president and CEO of Boston Private Bank & Trust Company, which he founded in 1985, and he spent 14 years with Citicorp, including 12 years in Europe, the Middle East, and Africa. Previously, he served as an officer in the U.S. Navy in Vietnam.
Rob served for seven years on the board of governors of the Investment Adviser Association, the national not-for-profit association founded in 1937 that exclusively represents the interests of federally registered investment advisory firms.
Where is the Stock Market Headed in 2026?
Nvidia’s Jensen Huang: The Ultimate Entrepreneur
Bill Gates and the Story of Microsoft
The Bull Market Climbs a Wall of Worry
A Painful Bear Market
Inflation: 40 Years Ago and Now
Subscribe For More Articles On
Get the latest trends and thought leadership to help you make smarter financial decisions.