The Case for Owning Oil and Natural Gas Stocks
“When you buy into a huge oil production company, how it works out is going to depend on the price of oil to a great extent. It’s not going to be your geological home runs or super mistakes or anything like that. It is an investment that depends on the price of oil.”
Warren Buffett, 2020
The purpose of this commentary is not to discuss the wisdom of initiating the Iran War, nor to forecast how long the conflict will last, nor even what the likely outcome of the Iran War will be. It is rather to consider whether owning oil and natural gas companies as well as other fossil fuel-related companies, such as pipelines, makes sense in a diversified portfolio. In doing so, we will examine the performance of stocks of companies in the energy sector of the S&P 500 over the past decades and more recently as well. For many of these companies, the price of oil appears to be the key factor, so we will trace the trajectory of the price of oil, too.
Since the Iran War commenced on February 28th this year, many barrels of ink have been spilled on the war’s effect on the price of oil. The global production of oil is approximately 105 million barrels a day, on average, and Iran’s stranglehold on the Strait of Hormuz has curtailed the supply of oil by an estimated 16 million barrels a day, according to a report by J.P.Morgan. This shortage of oil has caused the price of a barrel of West Texas Intermediate oil (WTI) to spike from roughly $67 to $112 a barrel as this commentary is being written on April 6, 2026. This supply shortfall has impacted Asian countries the most ‒ with certain nations needing to ration oil and gas. Europe is also affected by supply shortages. As the largest producer of crude oil in the world, the U.S. produces 13.5 million barrels of oil daily, and there are no supply issues here. In fact, the U.S. is a net exporter of crude oil and refined products (combined). The primary effect in the U.S. of the global supply shortfall of oil is the elevated price of gas at the pump, which currently averages around $4.00 a gallon. This is less than the $5.00 it reached in 2022, but nonetheless affects consumers, risks higher inflation, and lowers the country’s economic growth rate.
Investment Performance of Oil and Gas Stocks
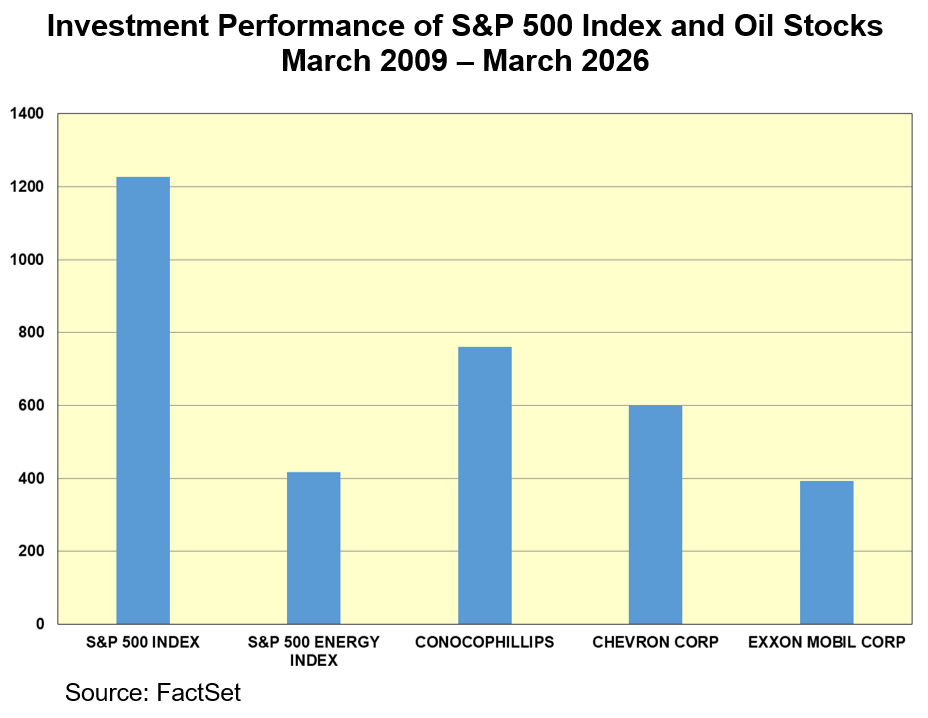
Since the current secular bull market began in March 2009, the S&P 500 has achieved a total return (including dividends) of over 1200%. During this same period, the energy sector of the S&P 500, which includes such well-known companies as Exxon, Chevron, and Conoco, has turned in a total return of only 417%. So, for this 17-year period, the energy sector of the stock market has dramatically underperformed the broader market. The chart on the following page shows the significant underperformance of leading oil stocks, as well as the energy sector of the S&P 500, compared with the S&P 500 Index during this long 17-year secular bull market:
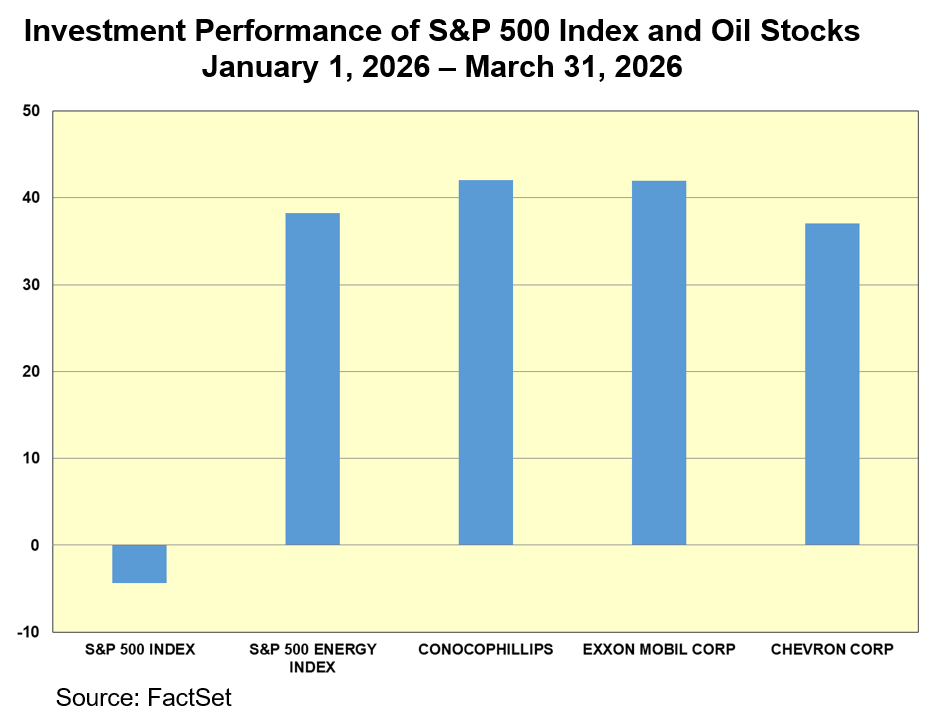
On the other hand, these same energy stocks had outstanding investment performance during the first quarter of this year, each of them turning in total returns above 30%. In comparison, the total return of the S&P 500 Index for this period was a negative -4.36%. The jump in the price of oil since the outbreak of the Iran War on February 28th has led to excellent short-term performance of stocks in this sector. The chart below demonstrates that a strong case can be made for owning these kinds of stocks during periods of geopolitical stress:
The Price of Oil Since World War II
For the first 25 years following the end of World War II, oil traded between $2.50 and $3.00 per barrel. But then in October 1973, following President Nixon’s action to provide financial and military support to Israel during the Yom Kippur War, the Organization of Arab Petroleum Exporting Countries (OAPEC) instituted an oil embargo on the U.S. which caused the price of oil to rise more than fourfold ‒ from $2.90 a barrel to nearly $12 a barrel in early 1974. For several months, there was actually gas rationing at the pump in the U.S. The price of oil remained between $12 and $15 a barrel during the remainder of the 1970s until the Iranian Revolution, which was in full flood by 1979. This caused the price of a barrel of oil to spike to $40, as strikes by Iranian oil workers cut the production of the world’s oil supply by 4.8 million barrels ‒ around 7% of the global supply. Once again there were several months when gas was rationed at the pump in several states in the U.S. In brief, the price of oil skyrocketed more than 13-fold in the 1970s ‒ caused largely by geopolitical events affecting the global supply of oil and refined products.
Energy Stocks as a Percentage of the S&P 500
With the price of oil rising so dramatically and the production costs remaining under control in the late 1970s and early 1980s, oil companies were enormously profitable, and energy stocks dominated the stock market’s performance. For example, if Exxon and Chevron shares were purchased in 1970 and held through 1980, Exxon’s total return was approximately 164%; Chevron’s was spectacular with a total return of over 400%. During the same period, the S&P 500 Index’s total return was approximately 78%. At the peak of the stock market’s infatuation with these stocks, the energy sector of the S&P 500 reached just short of 30%. Seven of the top 10 companies in the S&P 500 by market weighting were oil and gas companies. The chart below shows what an important part of the stock market this sector was in 1980 and its subsequent decline over the past four-and-a-half decades:

The Price of Oil
1980–2026
For the next twenty years ‒ from 1980 to 2000 ‒ the price of a barrel of oil trended down. High oil prices spurred a surge in non-OPEC production from the North Sea, Alaska’s North Slope, and Mexico, while also suppressing demand. The Asian Financial Crisis of 1997-1998 brought the price of WTI oil down almost 75% from its $40 high in 1979 to $10 in 1998. Then from 2000 to 2008, the price of crude soared. There was a surge of demand, sparked by China’s and India’s rapid industrialization, and combined with modest supply growth and a geopolitical premium engendered by the Iraq War, the price of WTI hit its all-time high of $147 in July 2008. But then it crashed to $32 by December, during the Financial Panic of 2008. The next decade saw the price of oil average around $50 a barrel until the COVID-19 pandemic saw the price of WTI plunge to roughly $21 a barrel at the end of March 2020.
The next geopolitical event to cause a surge in the price of oil was Russia’s invasion of Ukraine in early 2022, which caused the price of WTI to soar from roughly $80 a barrel to nearly $130 a barrel. But over the next three years, as the global supply of oil remained robust at over 100 million barrels a day, the price of WTI receded to an average of $65 a barrel in 2025. Then, of course, the Iran War caused WTI to spike from around $68 a barrel to $113. The charts below chronicle the price of oil since 2000 and more recently since 2022, showing the effect of the wars in Ukraine and Iran on the price of oil:

Environmental Debate over Fossil Fuels
During the past several decades, the environmental movement grew into a powerful force globally, with significant ramifications both culturally and politically. The movement to protect the environment was translated into government policies and entered the capital markets as well. Over time, government regulations were issued both here and abroad, and corporations were required to report the impact that their operations had on the environment. During the past two decades, many came to see global warming (later called climate change) as an existential threat to planet Earth, because of the CO2 emissions that carbon products emitted. And companies which explored and produced oil and gas were seen as a major part of the problem. In the capital markets, investors focused on ESG, which stands for Environmental, Social, and Governance. It is a framework used to measure a company’s sustainability, ethical impact, and risk management practices as they influence nature, people, and corporate management. For a time, this became a major focus for many investors, both institutions and individuals, and it often led them to avoid investing in fossil fuel companies. The environmental movement led to the search for renewable energy sources ‒ primarily solar and wind ‒ with significant capital pouring into this sector with varying results.
At BFS, some of our clients instruct us not to own fossil fuel stocks in their portfolios, and we, of course, follow their instructions. One of the reasons why the prices of most oil and gas stocks did not advance from 2008 until the outbreak of the Ukraine War in 2022 was that investing in fossil fuel stocks appeared to be putting money into a dying industry.
Over the past decade, a vigorous debate has developed about the science surrounding climate change. Some leading scientists represent the case that CO2 emissions do not pose an existential threat to the planet, while others continue to hold to the opposite view. On the political front, President Trump pulled the U.S. out of the Paris Agreement toward the end of his first term. Then President Biden rejoined the Paris Agreement in 2021. In 2025, President Trump withdrew the U.S. from the Agreement once again. President Trump views U.S. oil production as a primary strategic asset in global politics, forming the cornerstone of a doctrine known as “energy dominance.” He is known for his mantra: “Drill, baby, drill.” In the U.S., states have taken very different paths in regulating the operations of oil and gas corporations. For example, some have banned fracking completely. It is likely that this debate will continue politically for a long time. Meanwhile, it is also probable that renewable energy will continue to become a larger part of U.S. and global energy sources in the future. Nevertheless, the transition from fossil fuels to renewables as sources of energy is likely to take many decades. For example, 1.3 billion vehicles worldwide are still powered by gasoline and diesel, of which 265 million are in the U.S. Currently, there are only around eight million electric vehicles in the U.S. With the increasing demand for energy in the U.S. driven by A.I., it is likely that the need for fossil fuels will remain strong for many decades to come, which will help companies in the oil and gas industry.
Reasons to Own Oil and Gas Stocks
We at BFS understand that some of our clients may not wish to own these stocks, based on their beliefs and sentiments about the potential harm that fossil fuels might cause the environment. However, for clients who do not share those concerns, we do believe that there is a place in well-diversified portfolios for oil and gas companies. The case for owning fossil fuel-related companies can be delineated as follows:
- Income Generation: Many energy companies offer dividend yields well in excess of the typical quality growth stock. The dividend yield on the collection of companies making up the S&P 500 Index is currently 1.18%. Most of the Magnificent 7 stocks either pay no dividend, like Amazon, or have a dividend yield of less than one-half of one percent, like Alphabet, Meta Platforms, Nvidia, or Apple. On the other hand, leading pipeline companies, which transport much of the energy resources for industry and residences throughout the country, have dividend yields ranging from 3.5% to 5%. Some of the better Master Limited Partnerships (MLPs), which require filing a K-1 at tax time, have dividend yields as high as 7%. The leading pipeline companies also strive to increase their dividends every year, which can, over time, result in price appreciation as well. The large integrated oil companies like Exxon and Chevron also provide good income, with dividend yields of 2.7% and 3.7% respectively.
- Inflation Hedge: The price of oil increased more than 25-fold, from $3 per barrel in 1978 to around $80 before the outbreak of the Iran War. Inflation, as measured by the Consumer Price Index (CPI), increased by nearly 500% during this same period. These stocks can help maintain the purchasing power of an investor’s money.
- Capital Appreciation: The two largest U.S. integrated oil companies ‒ Exxon and Chevron ‒ have delivered very robust capital appreciation over certain periods, depending on the starting date. For example, Exxon had a compound annual growth rate (CAGR) of over 12% from 1980 through 2025, but from the market bottom in March 2009 through March 31, 2026, the CAGR was 9.8% compared with the S&P 500’s compound growth rate of 16.4%. In other words, an investor must purchase the stock at a favorable moment, when it is cheap, and hold it until a geopolitical event causes the price of oil to soar, benefiting the stock price.
- Portfolio Diversification: Energy stocks often exhibit low correlation to technology or communication stocks, enabling them to perform well when these or other sectors underperform. A good example of this is the performance of the energy sector of the S&P 500 in the first quarter of this year, which was up 38.3%, compared with the S&P 500 which fell -4%.
Conclusion
As described above, the total returns for oil and gas stocks during this 17-year secular bull market have been significantly lower than the broader market over the full term. But there are times and places when ownership of these stocks has made good sense. For investors whose primary goals are preservation of capital and distribution of income, leading pipeline companies, which often have a higher dividend yield than U.S. Treasury bills or intermediate duration investment grade corporate bonds, are excellent investments. For investors who are primarily interested in growth of principal, the quality integrated oil companies ‒ Exxon and Chevron ‒ can provide excellent returns when the timing is right. And that usually happens when the price of oil spikes due to geopolitical events such as the Russian invasion of Ukraine or the Iran War.
Rob serves as chairman of Bradley, Foster & Sargent. He is a portfolio manager and member of the firm’s investment committee and its board of directors.
Rob founded Bradley, Foster & Sargent with Joseph D. Sargent and Timothy H. Foster. Earlier, he was president and CEO of Boston Private Bank & Trust Company, which he founded in 1985, and he spent 14 years with Citicorp, including 12 years in Europe, the Middle East, and Africa. Previously, he served as an officer in the U.S. Navy in Vietnam.
Rob served for seven years on the board of governors of the Investment Adviser Association, the national not-for-profit association founded in 1937 that exclusively represents the interests of federally registered investment advisory firms.
The Fog of War
Pei-ju Lee quoted in Quartz article on AI boom
Why Market Cap Matters for Diversification
One Big Beautiful Bill: A Summary
Turning Savings Into a Financial Plan
New Year, Same Goals? A Financial Check-In
Laying the Groundwork for Financial Freedom
A Look at Cybersecurity in a Changing World
How to Create Wealth in Your Retirement Accounts
Investing in 2024: Pros and Cons of Modern Strategies
Gold is Moving, Time for the Miners
Gold Ascending
A Cautious Look into the Future
Private Finance – Opacity Is Not a Virtue
Finding Your Tax Equilibrium
The Limits of Largesse
Demystifying Secure Act 2.0
A Suggestive Failure of Market Confidence
Fed Up?
Housing: A Little Too Frenzied?
Thoughts on Bitcoin and Cryptocurrencies
Gold: A Case of Excessive Pessimism
The Fed’s Freedom to Tighten is a Paper Tiger
ESG Epiphany
Investing with Keynes
Cash Flow Reigns King
Euthanasia of the Lender
Subscribe For More Articles On
Get the latest trends and thought leadership to help you make smarter financial decisions.